The Hundreds Chart is a terrific tool for teaching your child basic math principles. It consists of the numbers to 100 in sequential order, with ten numbers per row across ten rows. The layout allows children to count left to right by ones, and down by tens. As well as teaching your child to count to 100, the hundreds chart can be used to help children with addition and subtraction, and multiplication and division.
Learning Addition and Subtraction
- You can begin to teach children how to add and subtract by using a marker. The equation 14 + 5 can be completed by placing a coin as a marker on fourteen and moving it five places forward to 19.
- Similarly subtraction can be demonstrated to children. The equation 14-5 is shown with a coin placed on fourteen and moving the coin five spaces backward.
- Practise adding ten to numbers. Show your child how adding ten is just one vertical move of the hundreds chart.
- The beauty of the chart is that it allows children to attempt challenging addition and subtraction. Example 53+22 = from 53, moving down two columns and across 2 spaces.
Learning Multiplication
- Start by getting your child to colour in all the multiples of the times tables you are trying to teach. Discuss with them the pattern that appears.
- Compare the coloured multiples to the times tables you are teaching. Example 2 x 3 (or two lots of three) is the same as two counters across three spaces each.
Learn more at our hundreds chart multiplication pattern page.
Conclusion
The 100s chart is a great tool for visually representing a number of different early math concepts.
Take care to ensure that you only use the chart as a teaching aid, not as a calculator for determining solutions. Children still need to learn to solve equations in their head.
Two Versions
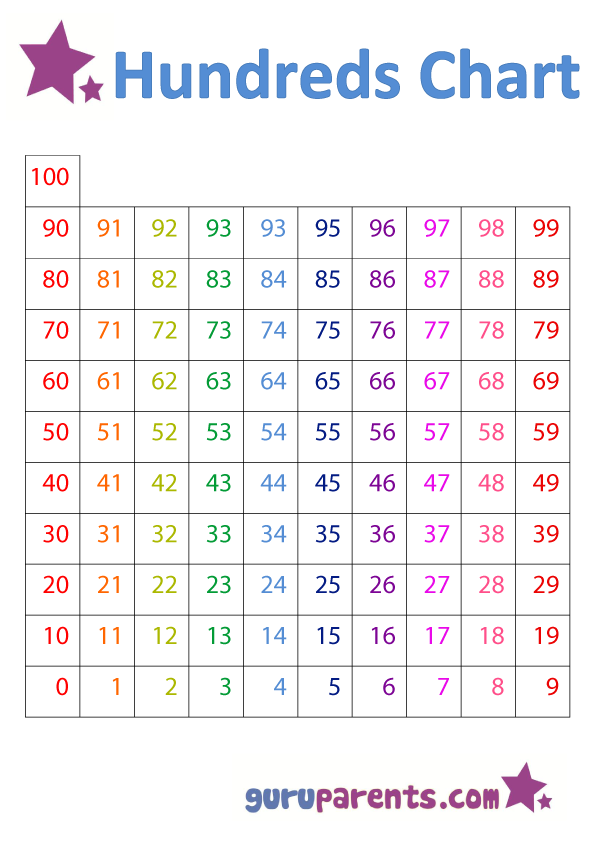
We have included two versions for your use in pdf format: 1-100 hundreds chart and 0-100 version. The 1-100 version of the chart is the most common format used.
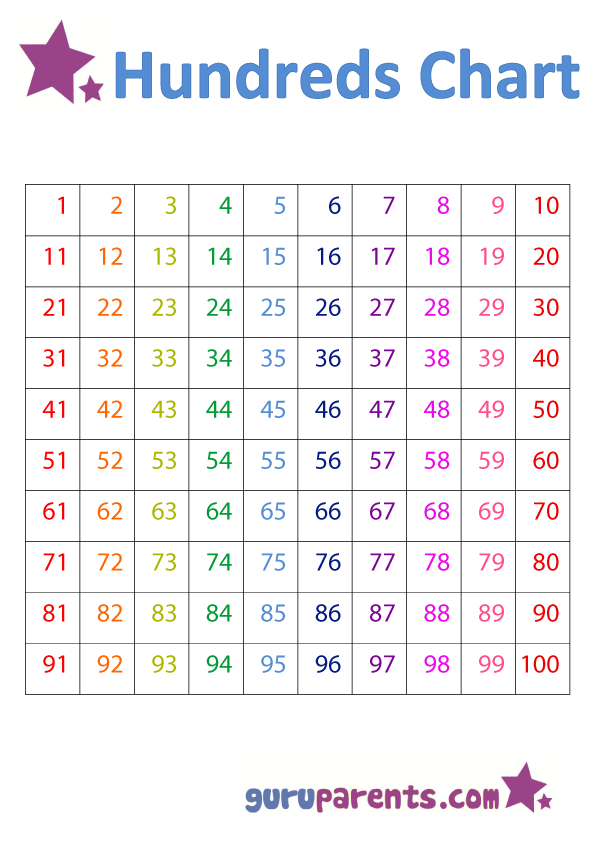
However, the 1-100 version does have some slight drawbacks that you should understand. The numbers increase as you go down the chart – this causes a few problems. Firstly it is not consistent with the way numbers are graphed – numbers increase as you go up a graph.
Secondly, people have a tendency to speak about numbers that are higher or lower in value – which is the opposite on the 100s chart, as numbers that are physically lower on the chart are higher in value and vice versa.
The other problem with the standard chart is the number at the end of each row is not consistent with the preceding numbers (ie 59, 60). In fact the numbers at the end of each row are more consistent with the numbers on the following line.
These issues have been rectified in the 0-100 version of the chart.